After I did a brief posting on Air Conditioning Mechanism, Dr. Johnson has suggested some cool ideas and concepts regarding thermodynamics that I may be able to analyze.
Then, I decided to see if Carnot Cycle was applicable to air conditioning.
For those of you who do not know what Carnot Cycle is, it shows most efficient cycle for converting a given amount of thermal energy into work, or conversely, creating a temperature difference (e.g. refrigeration) by doing a given amount of work. If you do not follow, please refer to the picture below.
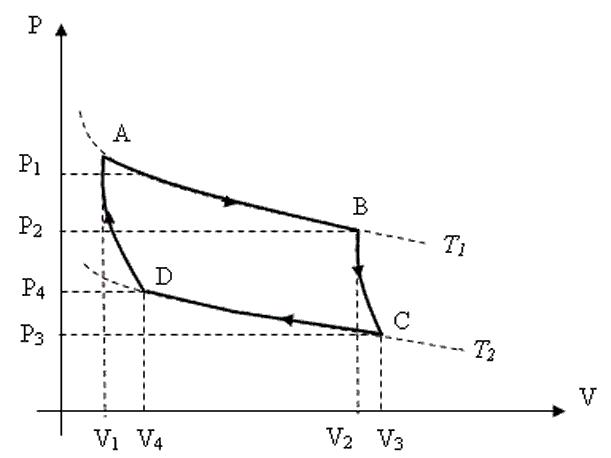
Y axis represents pressure, while x axis indicates the volume. Before we begin, know that![]()
This means, Work is equal to area under the curve. For instance, the work required from moving point C to point D is same as the area under the line CD. (Whether the work is done by the system or on the system really depends on the direction of cycle. We’ll get there later.)
Awesome, let’s try to use this model to describe the behavior of freon gas, the refrigerant used in most of air conditioning systems today.
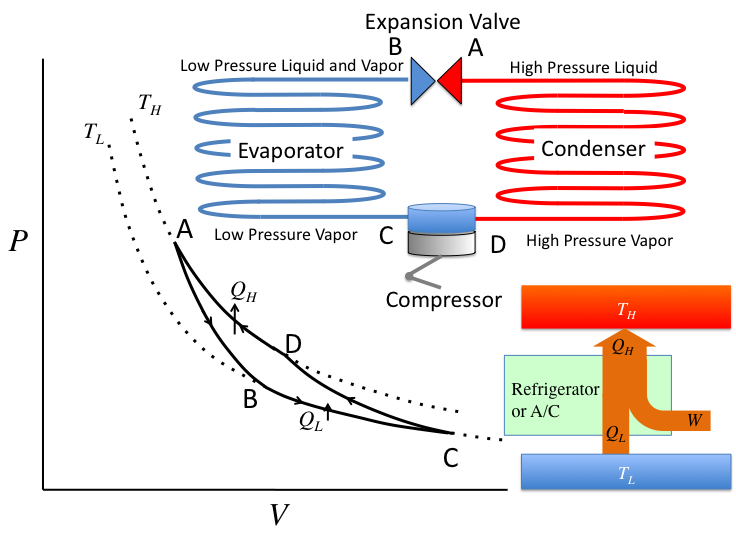
First, freon begins as a cool gas at point C. When it is compressed into a hot, high pressured gas, the gas reaches to a point D. (High Pressure and Lower Volume). Great, as this high pressure gas travels through condenser coils (Red line), it begins to lose heat and turns partly into a liquid (Lower volume but higher pressure). And when it enters the expansion valve, it travels cooling coils (Blue line), where the gas begins to gain heat and where its volume increases, converting its phase into gas again. (Point A to B) The same occurs from B to C, where the freon liquid absorbs heat to become gas. This carnot cycle basically repeats continuously.
It’s awesome, but is there a way for us to calculate the net change in Work? This is will basically allow us to find out how much work has been taken out or absorbed by the system. Accordingly, we will learn how much heat room lost due to this activity.
Like I said earlier, Work is equal to the area under the curve. However, we want to figure out if the system(Freon Gas) did the work, or received work. The key is to find out the direction of the cycle, which in this case is counter-clockwise direction.
Let’s look at the graph again. From point C to A (through D), freon goes through compressor and becomes high pressured, which means that outside environment did work on the system. Thus, Work has been added. (+W) From point A to C, freon travels through the coils in the room, absorbing heat. Thus, the gas did work on the system. (-W)
At this point, you should have noticed a huge secret to this graph… Yes, the area of that rhombus looking shape gives the net change of Work in the system, which in this case is positive. (The area under C to A is larger than that of from A to C). This suggests that we need outside work to operate air conditioner, and as you should all know, our electricity supports this work.
Isn’t this stunning? Proving that we need work from outside through studying carnot cycle? Really, this concept can be applied to any engine, cycle, or thermodynamic process!
